Deep Dive into Clean Energy Stocks
Plotting a rebound? A proprietary view into the potential of clean energy stocks in 2022
Quick summary
Becoming investable - Trading multiples are improving and converging with the wider market, hence providing reasonable valuation amid Fed’s tapering cycle
Strong backbone - Wind and solar continue to have strong positive outlook with consistent growth, strengthening top-line growth
Policy boosts - EU taxonomy alignment and Biden’s infrastructure plan may be the tailwind despite uncertainties around macroeconomic outlook and geopolitical tension.
A push from behind - Oil and carbon price surges may boost clean energy performances with some extent of correlations
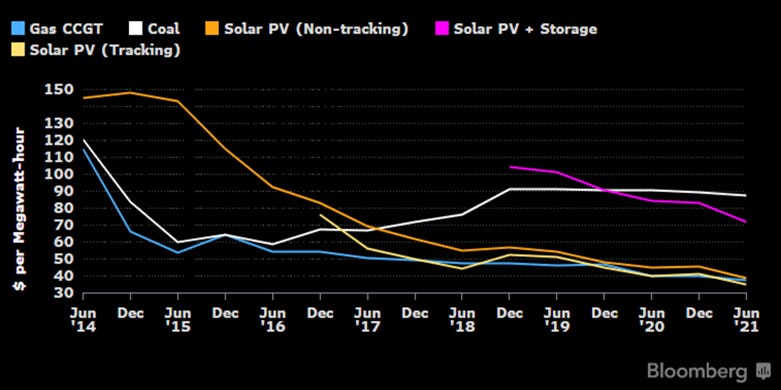
As energy transition became the key topic for sustainable investing, clean energy stocks have attracted an unprecedented number of investors who believe in the importance of green energy transition while hoping for stock outperformance over the long term. Such high growth in public and private investments coupled with necessary technological advancements have made renewables cheaper than the traditional energy sources, hence enabling the green transition to take place.
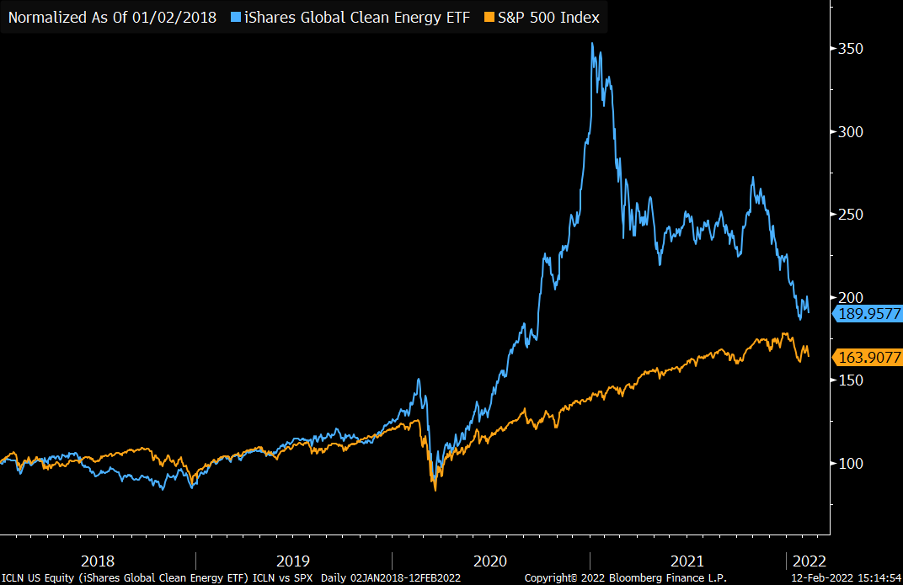
However, clean energy stocks have not been performing as investors wished. The largest ETF tracking top clean energy firms globally (iShares Global Clean Energy ETF, ICLN), alongside the S&P Global Clean Energy Net Total Return index have dropped for about 15% since the beginning of 2022. This is a huge underperformance when compared with the S&P 500 with around -7% year-to-date return. This could mainly be caused by the market anticipation of Fed’s tapering cycle that will trigger a rise in interest rates, thus making the future earnings of high-growth clean energy firms to be valued lesser.
When looking from a longer timescale (since Feb 2020 – just before covid hits at a global scale), the previous surge in clean energy stock prices is coming to an end with convergence to the wider market (S&P 500). Does this signal that the clean energy stocks may finally become investable again?
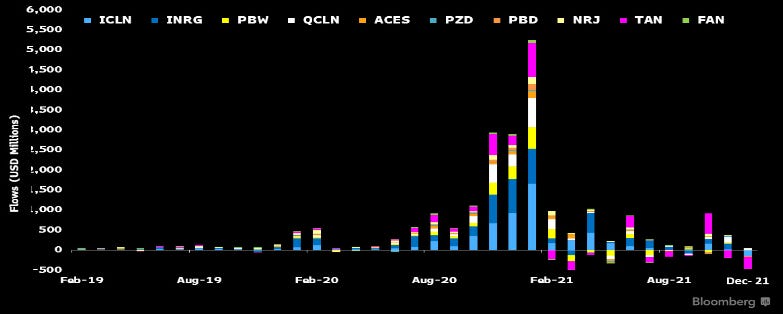
And perhaps unsurprisingly, the flows of top clean energy ETFs are pretty much correlated with the funds’ performances.
Becoming investable? From a valuation standpoint
Valuation and trading multiples need to be assessed to determine its investment case.
However, it is worth noting that multiples do not accurately value securities, but rather providing a relative valuation with the comparable peers. Besides, the acceptable multiple in one industry is different than that of the other industries. For all the multiples used below, lower multiple means lower valuation (hence better), and vice versa.
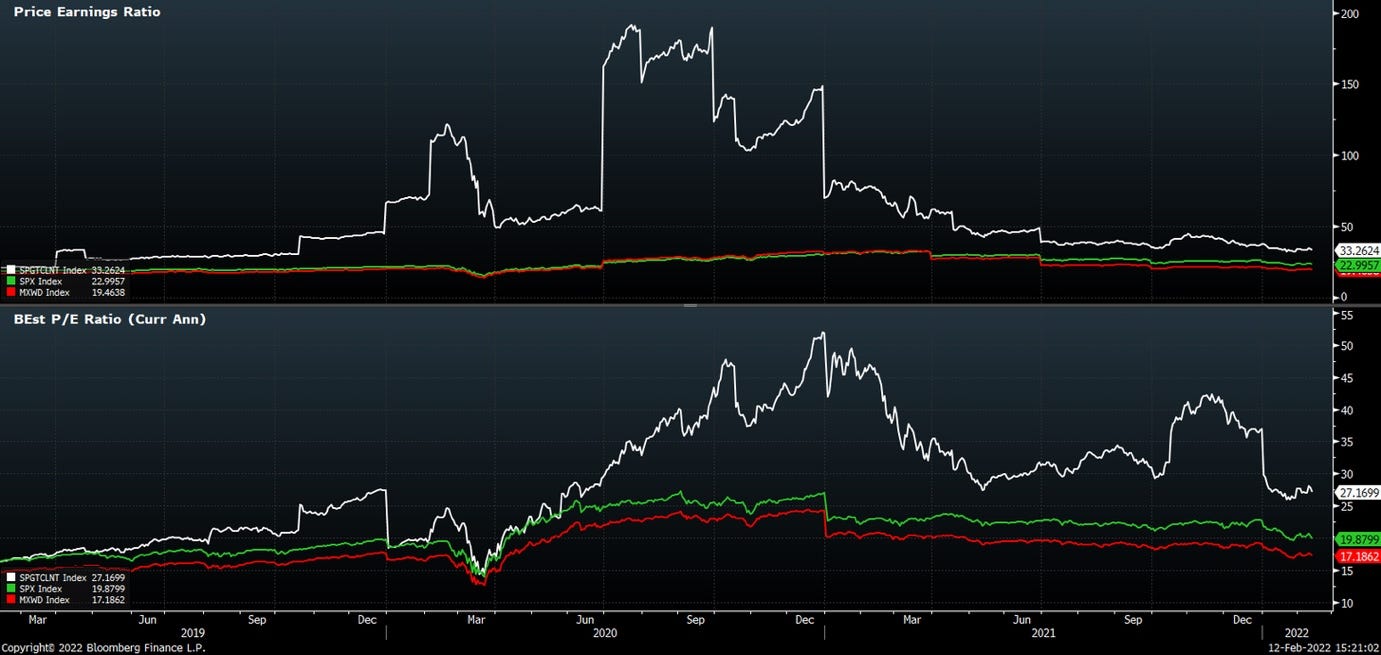
Using the price to earnings ratio (perhaps one of the simplest measurements), the S&P global clean energy index (SPGCLNT) is showing clear convergence with the market indexes such as the S&P 500 (SPX) and MSCI All World Index (MXWD), demonstrating that the clean energy stocks are now valued at a much more reasonable level in alignment with the wider market.
On the other hand, the EV/EBITDA ratio now falls between the levels of SPX and MXWD, further justifying its moderate valuation level compared to the entire market.
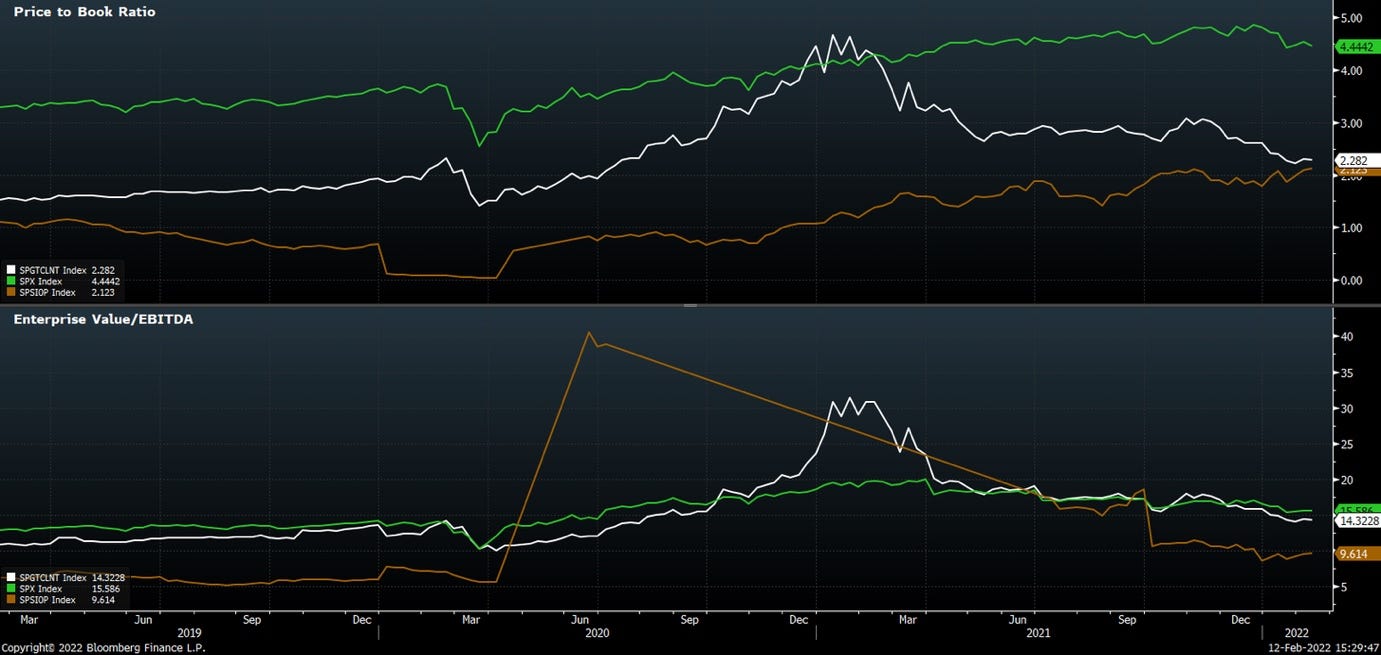
When including the S&P Oil & Gas Exploration & Production Select Industry Index (SPSIOP), we can see that even though the EV/EBITDA ratio of SPGCLNT remains above SPSIOP since the recent surge in oil and natural gas prices, their price to book ratio is converging while becoming distant from the tech-heavy SPX. This suggests that clean energy stocks are currently trading at a reasonable price relative to its asset-heavy peers in the oil & gas industry.
The case for wind and solar energy
Wind and solar energy production is by far the most significant compared to other renewable sources (except for nuclear, which involve many controversies worth discussing in a separate newsletter).
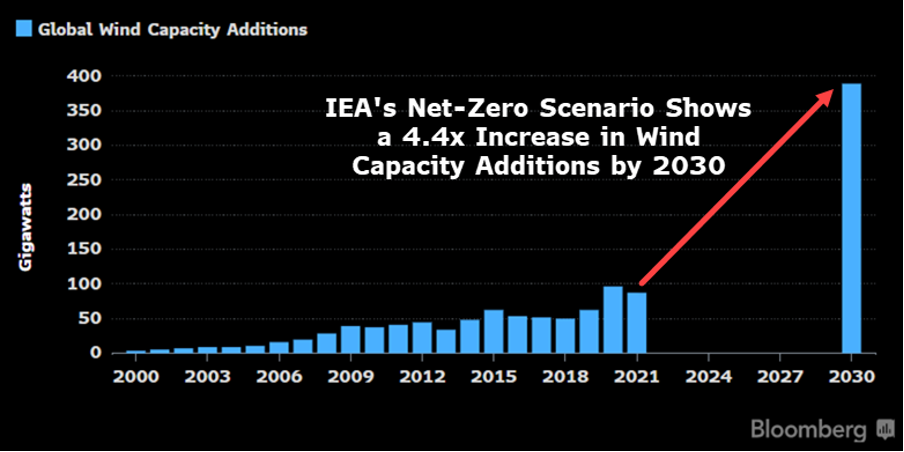
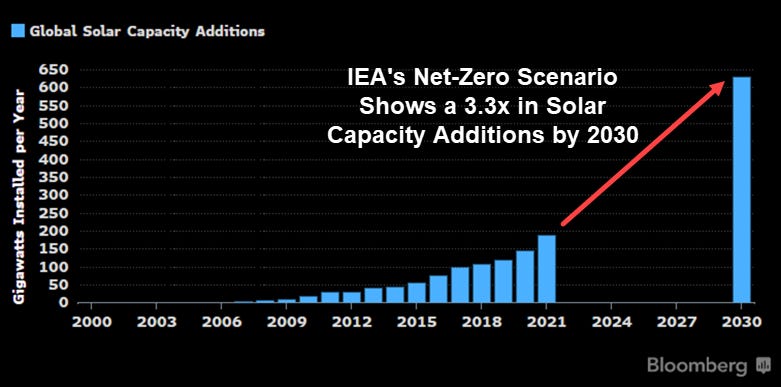
The outlook for wind and solar energy is still strongly positive with projections from the International Energy Agency (IEA) showing a 4.4x increase in wind and 3.3x increase in solar capacity additions by 2030. Those are equivalent to ~18% and ~14% CAGR for the wind and solar energy capacity growth respectively, which far exceeds the average growth for traditional energy production.
With sufficient financial incentive and technological capabilities, achieving such projections may just be a matter of time.
The policy boosts
Clean-energy names may experience regulation-driven upside in 2H to late 2022 as investors seek to secure EU taxonomy alignment for their portfolio. While the clean-energy theme has expanded, with a broader pool of stocks, the original pure players are most likely to be able to provide 100% alignment and non-significant-harm requirements, so we could see crowding back into the original 40 major clean-energy pure players in a rush to get exposure (Bloomberg Intelligence).
Apart from that, Biden’s infrastructure plan may also be giving a long-term boost to the clean energy firms in the effort of accelerating the US green energy transition. The roughly $1.9 trillion Build Back Better climate and social spending legislation contains about $200 billion in energy-related tax credits.
A push from behind – surging oil and carbon prices
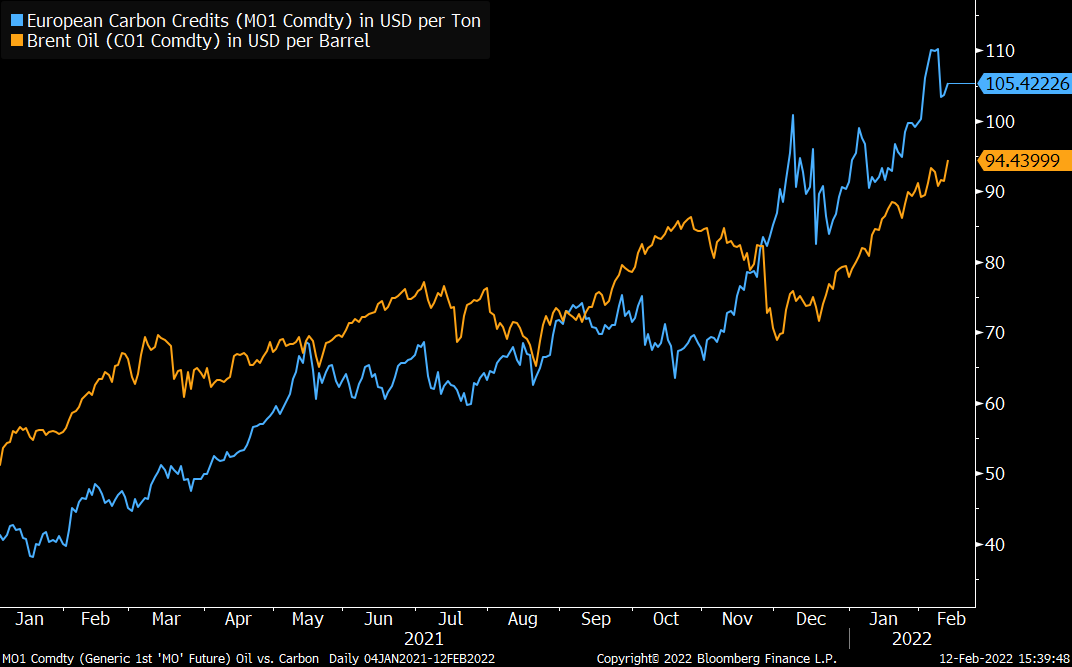
With rising price of oil and carbon amid Europe’s energy crisis, clean energy stocks may be getting a ‘push from behind’ as the adoption of renewable sources must now be accelerated to ensure the ecological and economical sustainability of energy generation, as the use of dirty energy sources may just become increasingly expensive.
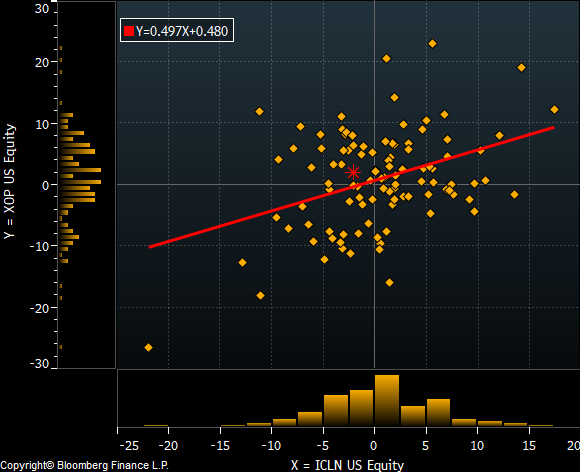
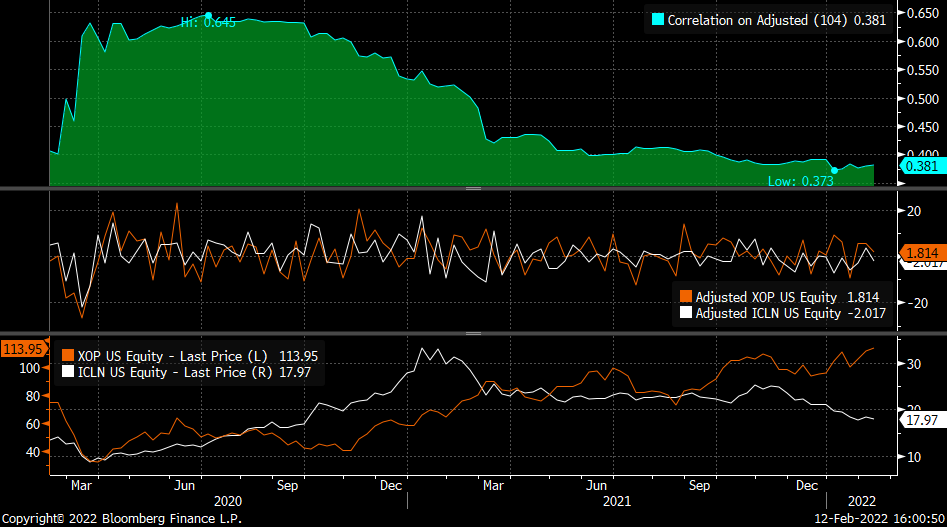
Interestingly, there have been statistically significant positive correlations between clean energy and oil & gas stock returns.
Note: ICLN stands for iShares Global Clean Energy ETF; XOP stands for SPDR S&P Oil & Gas Exploration & Production ETF; NEP stands for NextEra Energy Partners; BP stands for BP plc. The first pair is an index comparison, while the second pair is individual stock-level comparison between clean and traditional energy firms.
Similar results are found when comparing between the clean energy ETF’s return with oil and carbon commodity prices.
Note: ICLN stands for iShares Global Clean Energy ETF; CL1 stands for Crude Oil WTI (NYM $/bbl) Front Month; KRBN stands for KraneShares Global Carbon Strategy ETF. The first pair is a comparison between the clean energy index and oil price, while the second pair is a comparison between the clean energy index and carbon price.
This may be explained as both the clean and traditional energy firms/ commodities are all tied within the same industry, hence facing similar exposure in the markets. It could also be the evidence for the ‘push from behind’ thesis as the rise in oil or carbon prices increases the oil companies’ revenue, hence also pushing for greater expectations for clean energy stocks.
Has it peaked?
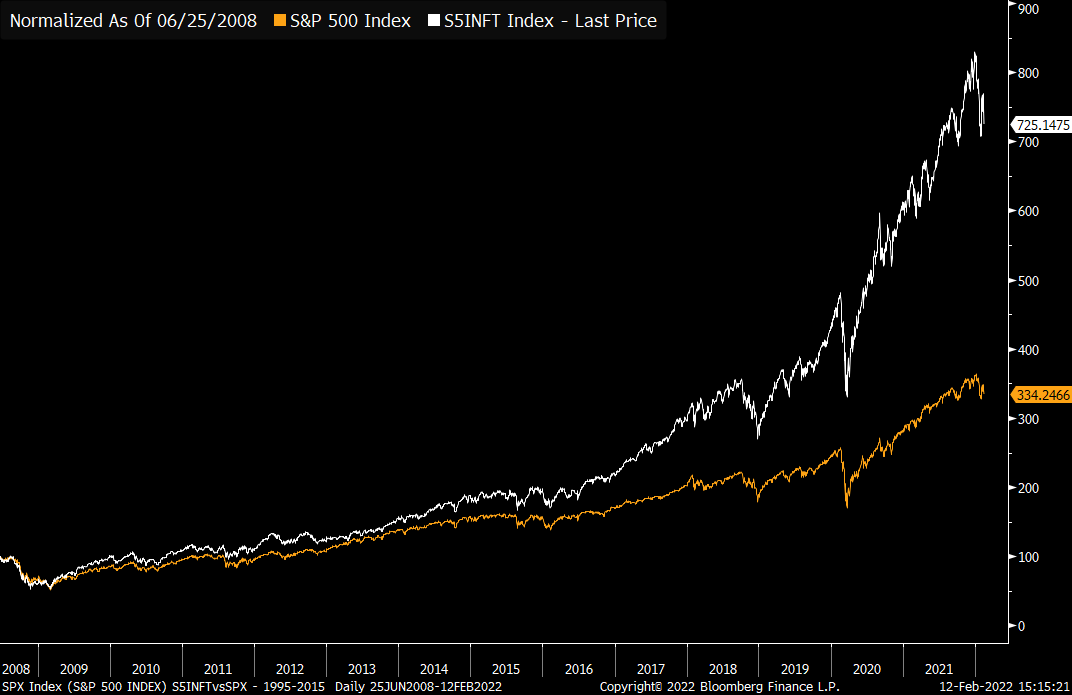
While clean energy stock prices may seem to have peaked towards the end of 2020, it may still have room to grow due to its transformative impact and scalability potential. If it successfully sustains strong revenue growth with improving profitability over time, clean energy stocks could be on track to follow the trajectory of information technology stocks with strong outperformance over the average market.
In short…
Clean energy stocks have now become much more attractive with maturing financials and business models. However, uncertainties around macroeconomic outlook and geopolitical tensions may undermine those encouraging factors. Nevertheless, 2022 could be a year for clean energy stocks to rebound with solid fundamentals and strengthening future outlook.


